The CLog

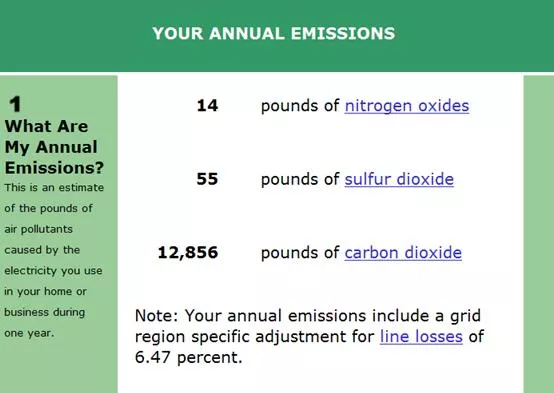
- Average annual household emmissions, according to the EPA.
The EPA has updated its eGrid database. (The agency calls it the "Power Profiler," and it's only as up-to-date as the EPA's 2007 numbers. smh) All you have to do is click the link, enter your zip code, select your power company — which, in North Carolina likely means selecting Duke Energy or its new purchase, Progress Energy — and check the stats. You can even find out your home and business' estimated "footprint."
See for yourself: Click here to find out what powers your world.
What you'll likely find here in Charlotte is that more than 50 percent of our energy is generated by coal combustion, which is slightly higher than the rest of the country; almost 40 percent of our energy is produced in nuclear power plants, which is quite a bit more than the national average; and the rest of our energy is generated with a little of this, a little of that — hydro, gas, oil and something called "non-hydro renewables" (aka solar, geothermal, biomass, landfill gas and wind).
As far as our emission rates, not counting sulfur dioxide (which is neck-and-neck with the national average), they're slightly less than the national average for carbon dioxide and nitrogen oxide. That's good to know, since we mostly want to just breath oxygen.
You're going to need a year's worth of your power bills for the last part of this exercise, or at least an average (which is probably listed on your bill). Enter your actual energy consumption, then find out what kind of emissions your home and business are creating. Or, you can skip to the end and pretend you fit the average monthly average profile. (Pictured above.)