
I don't have a will. How will anybody know what Tears for Fears songs to play at my funeral?
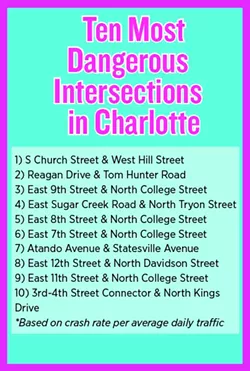
These are the thoughts going through my head as I idle behind a Chevy Malibu at the intersection of the East 3rd-4th Street Connector and North Kings Drive. It's rush hour and I'm stuck in the far left lane, which could easily tie with Black Friday at Walmart in a 'Worst Fucking Place on Earth' contest.
I rev the engine and lock eyes on my destination: the Interstate 277 on-ramp ahead on the right side of the road. To reach I-277, I'll have to speed out of the intersection (a pathetic median of white plastic barrier poles prevents me from merging before crossing North Kings), then cross four lanes of bumper-to-bumper traffic and swing a sharp right turn onto the on-ramp. According to Google Maps, I'll have exactly 528 feet to accomplish this. If the engineer that designed this stretch of road intended for drivers like me to have a 'life flashing before my eyes' moment, mission accomplished.
Recently released crash statistics rank that intersection the 10th most dangerous intersection in Charlotte. It joins a list of 98 intersections across the city designated by the Charlotte Department of Transportation (CDOT) as 'high-accident locations.' Though these 98 intersections represent a mere 0.51 percent of Charlotte's 19,242 intersections, they account for 8.5 percent of all non-highway collisions recorded in 2015.
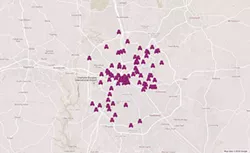
- An overlook of the locations of 98 intersections deemed as “high-accident locations" by the CDOT.
CDOT released its annual Traffic Collision Data (TCD) report last month, and the numbers paint a startling picture for our ever-growing city: 27,648 non-highway collisions were documented in 2015, a more than 20-percent hike from the year prior. During that time period, the population grew by just over 2 percent. Charlotte residents now have a 1 in 30 chance of being involved in a collision on surface streets over the course of a year.
The data follows an assessment that came earlier this year from Allstate Insurance Company's annual Best Drivers Report, which ranked Charlotte 150th out of 200 major US cities for driver safety. With a crash rate 23.8 percent above the national average, we're worse than New York City. Let that sink in.
While comment section pundits were quick to blame the unfavorable stats on lead-footed northerners or distracted driving, CDOT's numbers tell a different story.
Of the 27,648 non-highway collisions recorded in 2015, speed was determined to be a contributing factor in 13 percent, down from 18 percent in 2014. Inattention and distractions like cell phone use accounted for 18 percent of accidents; an improvement from 2014's 22 percent.
Those aren't the only categories where Charlotte drivers improved. The 2015 reports attributes alcohol use in 1 percent (or 278) of collisions — that's down from 317 collisions (1.38 percent) in 2014. We even got better at respecting fellow drivers — failure to yield to right of way contributed to 10 percent of accidents in 2015, down from nearly 12.5 percent in 2014.
So what's the problem? What factors are actually responsible for the increase in collisions? That answer might lie in a pile of discarded data.
It's up to CMPD officers to determine what caused a crash, using an official DMV 349 form to categorize contributing circumstances in every collision. The list is basically a smorgasbord of everything that can go wrong, like drug use, ignoring a stop sign, driving a lemon, passing a stopped school bus, etc. The list offers nearly 40 different crash factors to choose from, and most categories account for less than 1 percent of total collisions.
If we bundle together all the data from this very specific list of categories, we have an explanation for about 60 percent of total collisions. With those factors like alcohol use and texting out of the way, a whopping 10,999 crashes remain, dumped into ambiguous categories like "undetermined," "no contributing circumstances indicated," "unable to determine," and, my personal favorite, "unknown."
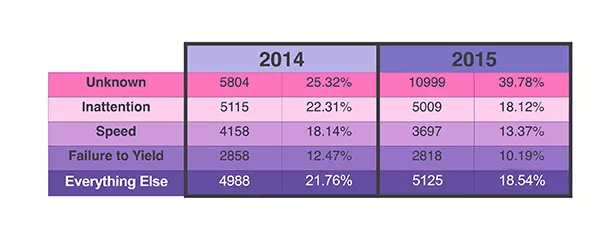
- The above graph shows a comparison of official crash causes reported by CMPD between 2014 and 2015.
As a recent college graduate and author of countless term papers, I can appreciate CDOT's knack for saying the same thing four different ways. What's troubling, though, is that this leaves the contributing circumstances of 40 percent of the collisions on Charlotte streets in 2015 as completely unaccounted for, their official causes basically labeled as "Who the hell knows?"
CDOT Traffic Safety Manager Angela Berry attributes this year's spike in 'cause unknown' crashes to a software glitch that prevented coding for 6,000 crashes, but comparing reports from previous years shows that ambiguous data is nothing new in the TCD report. In recent years, the amount of crashes with no real cause has grown, making it harder to find solutions or prioritize how to educate drivers.
"We understand that it can be difficult to get all the answers," Berry concedes when pressed about the gaping hole in the data.
While 2015 saw an improvement in accidents caused by distraction or inattention, Berry says those issues remain a priority for her department.
"Distracted driving continues to be a primary focus for CDOT," she says. "We believe those statistics are underreported in the crash data."
Though the TCD report finds nearly 40 different ways to place the blame on Charlotte drivers, some alarming stats seem to suggest that it's time we look for answers outside of the driver's seat.
According to the 2015 stats, 68 percent of collisions occurred in broad daylight and 78 percent occurred on dry roads. Half of the fatal wrecks to occur in Charlotte last year occurred at speeds at or below the posted speed limit. We know that Charlotte drivers have improved in multiple categories on the 'contributing circumstances' list, so when the total number of accidents still increases by nearly 21 percent, maybe the problem isn't the drivers or the weather or the time of day ... it may be the roads.
We already know that 8.5 percent of accidents occur at high-accident locations. Why aren't we looking more critically at these intersections?
Same shit traffic, different day: I find myself parked on the Interstate 277 off-ramp, waiting to merge into the far left lane of East 12th Street. The problem here is that drivers have about 125 feet to cross over three lanes of traffic before making a right turn onto North Davidson Street. This is exacerbated by the fact that drivers in the right lanes are often desperately trying to merge into the left lanes to access the I-277 on-ramp after the light.
It's not uncommon to see cars completely sideways on 12th Street, waiting for a spot to open up in the right lane. Often, a line of cars is backed up onto I-277, blocked by the one car at the end of the ramp waiting to merge right. This junction (technical term: clusterfuck) is the eighth most dangerous intersection in Charlotte.
Or consider sitting in traffic on N. College Street at the 7th Street light, with the Levine Museum of the New South on your right. That intersection is the sixth most dangerous in Charlotte, and if you plan on exiting the city by that street, you'll pass three more of the city's 10 most dangerous intersections in the next four blocks.
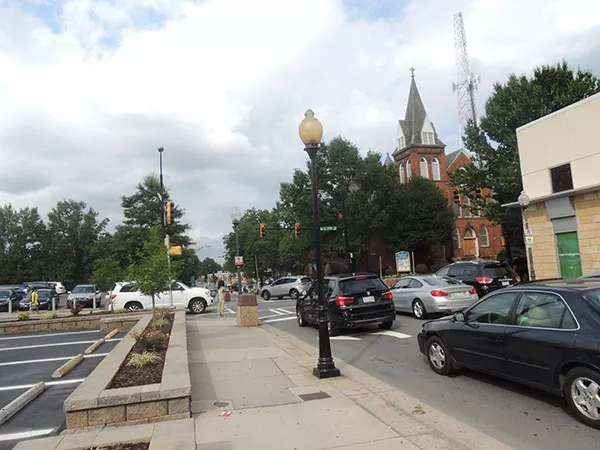
- Ryan Pitkin
- Beginning at this intersection with 7th Street, northbound drivers will pass four of the eight worst intersections in Charlotte in a five-block stretch of N. College Street.
This begs the question: What is the problem with College Street? The road seems benign enough. It's probable that the overhwelming numbers of those working Uptown looking for a way out every day at 5 p.m. have become too much for the skinny, one-way street.
While documenting traffic trends in high accident locations is a good start, we can't get the full story without finding a way to consider what role road design plays in a collision. Berry says finding this connection is easier said than done.
"CMPD officers are not engineers and should not be making qualitative assessments that are outside their specific area of expertise," Berry explains. "Roadway design is broad and complex and takes into account many factors."
Fair enough; road engineering is a tough gig, but it doesn't take an expert to recognize that Charlotte is outgrowing its roads.
"The state and the city have a long history of funding transportation improvements, but the past level of investment has not kept pace with the relentless growth our region has experienced over the last several decades," Berry says.
According to Berry, Charlotte is projected to welcome about 400,000 new residents between now and 2040. These new residents will likely bring around 250,000 more vehicles with them.
"But, they will not be bringing additional streets, travel lanes, traffic signals, bike facilities, sidewalks or any of the other infrastructure required to keep people and goods moving throughout Charlotte," Berry says. "Keeping pace with growth will require consistent and continued investment by the state, region and Charlotte."
As the future of the already outgrown roads remains unclear, I'd like to make a suggestion to those 400,000 incoming residents: Bring your bikes.